
Trending
Products and markets on the rise or in decline
Trending ranks the products and markets growing fastest or falling hardest, from Indonesia's exports and from world demand.
All 10 Market Data features are included in the Free plan during beta.
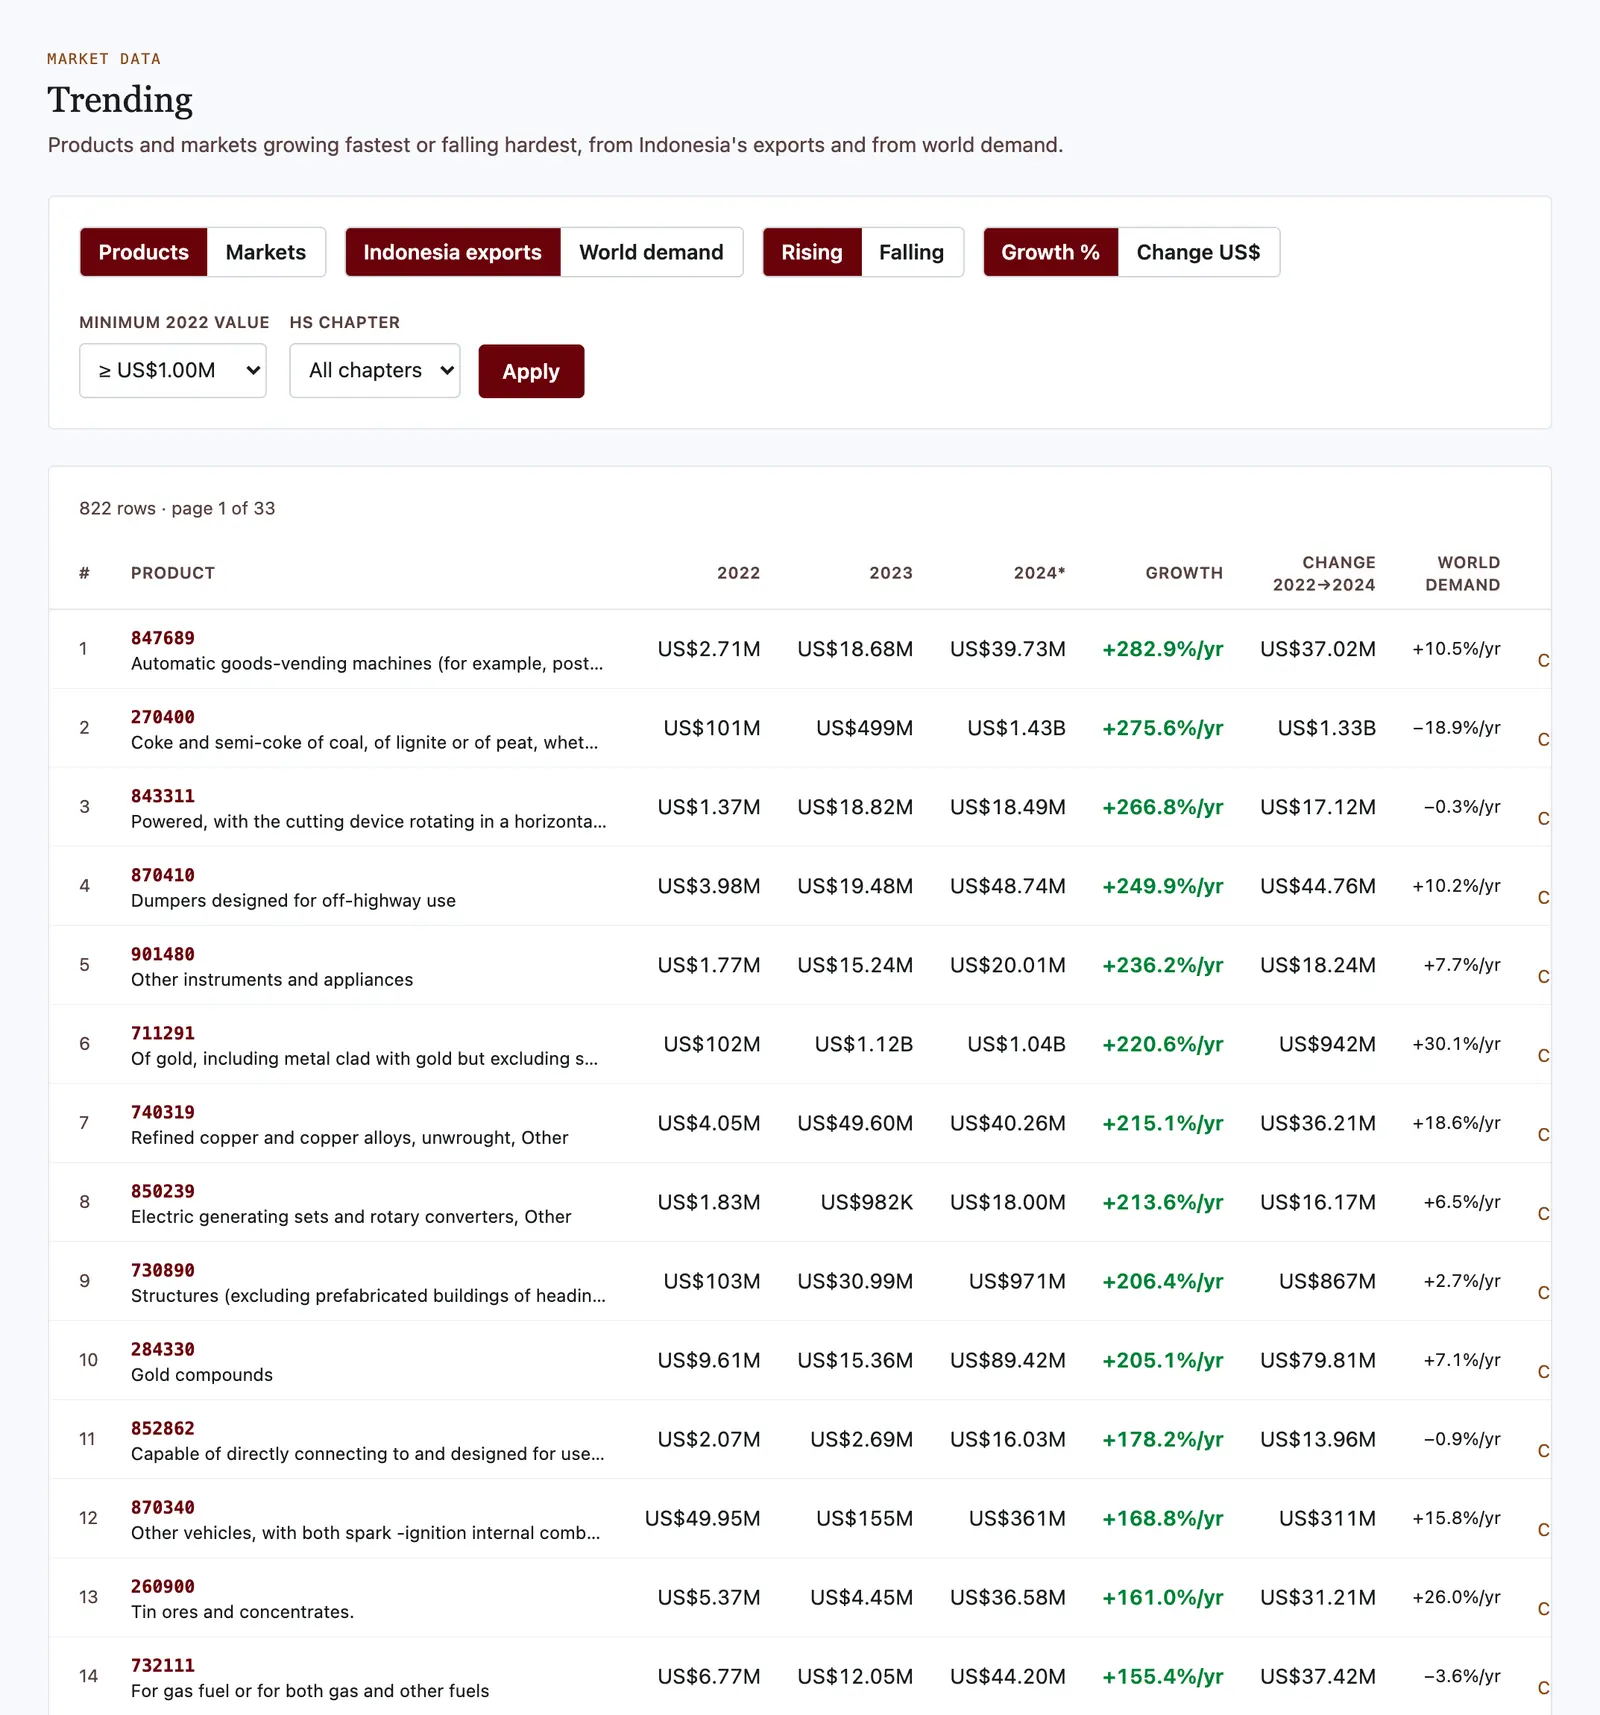
What it shows
- Indonesia's exports or world demand
- Products and markets, rising or falling
- Products that stopped being exported show as −100%
- Newly emerged products and abnormal spikes are shown separately
Rising or falling products
Choose Indonesia's exports or world demand, rising or falling, sort by percent or US$, and filter by starting value and HS chapter.
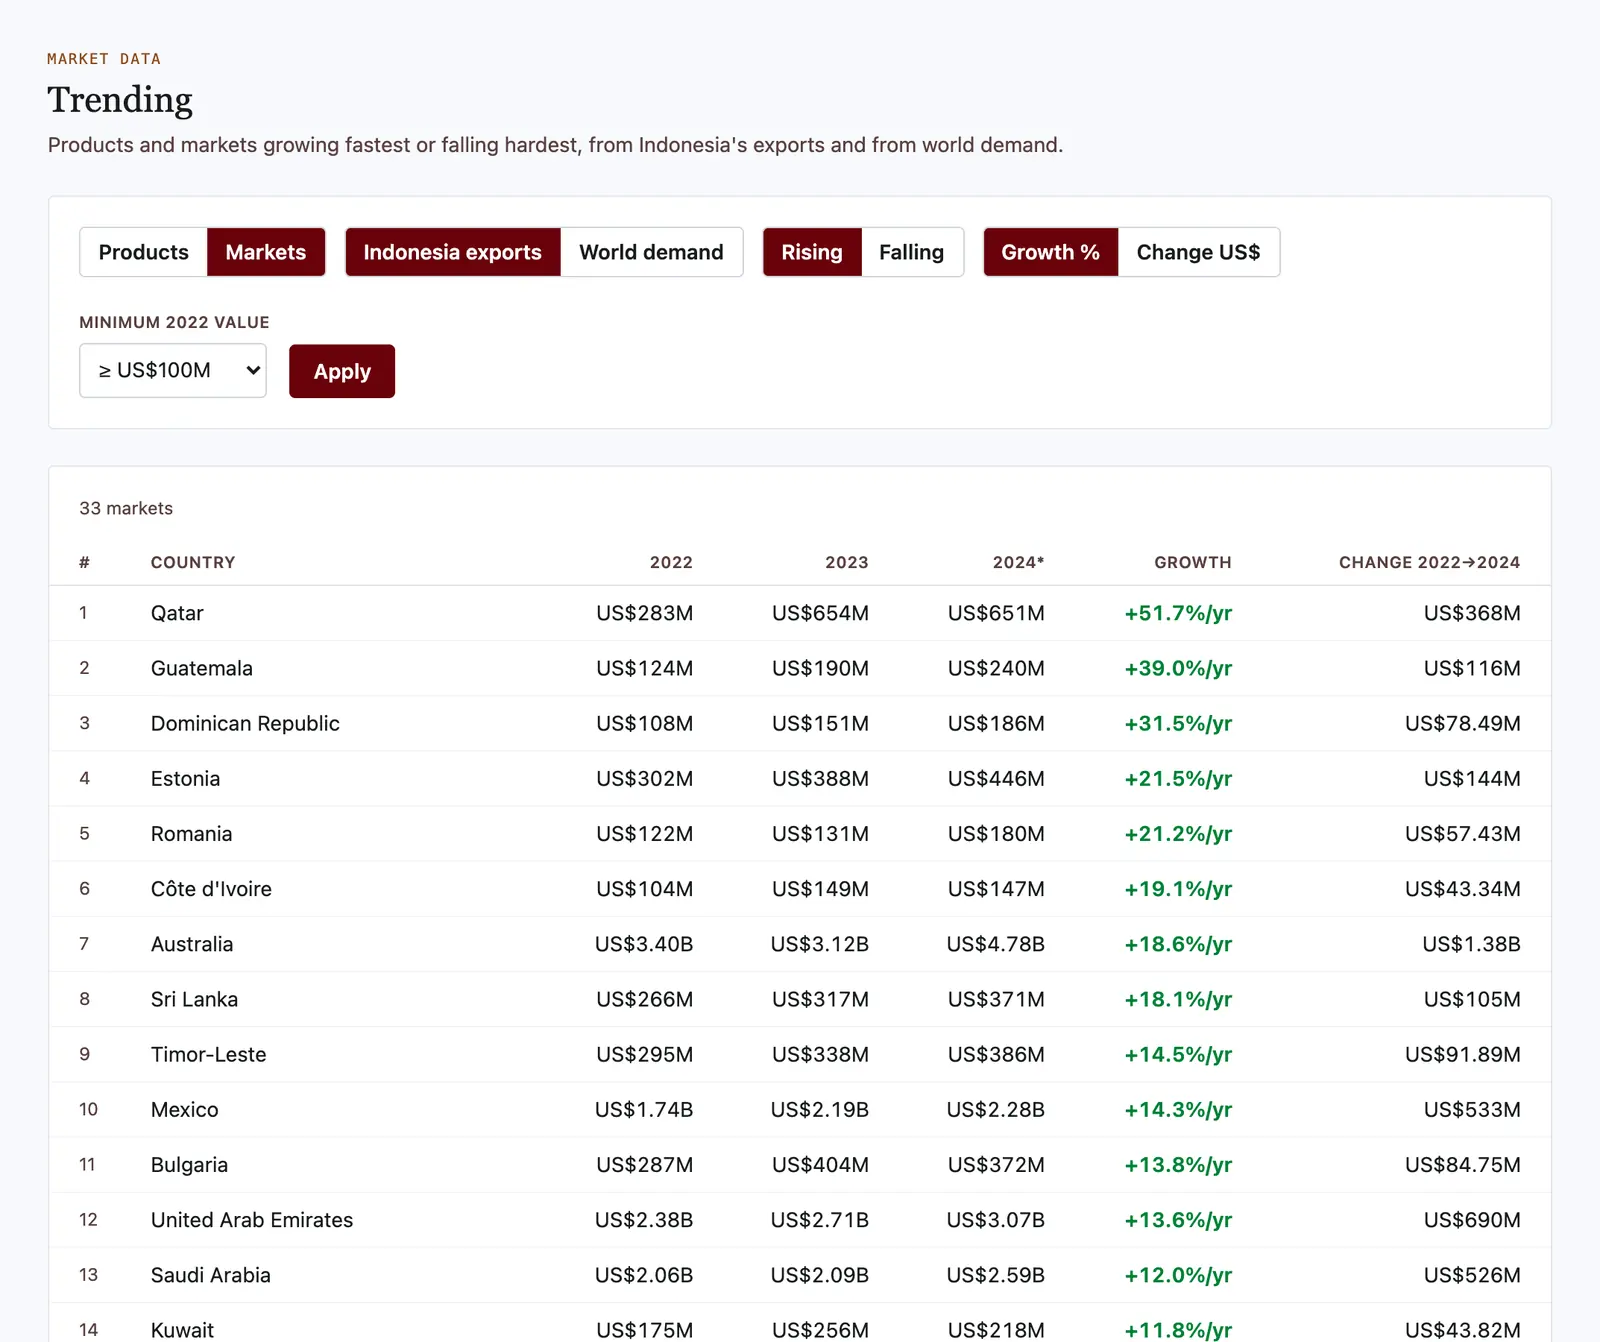
Growing markets
The Markets tab ranks destinations by Indonesia's export growth or by their total imports.
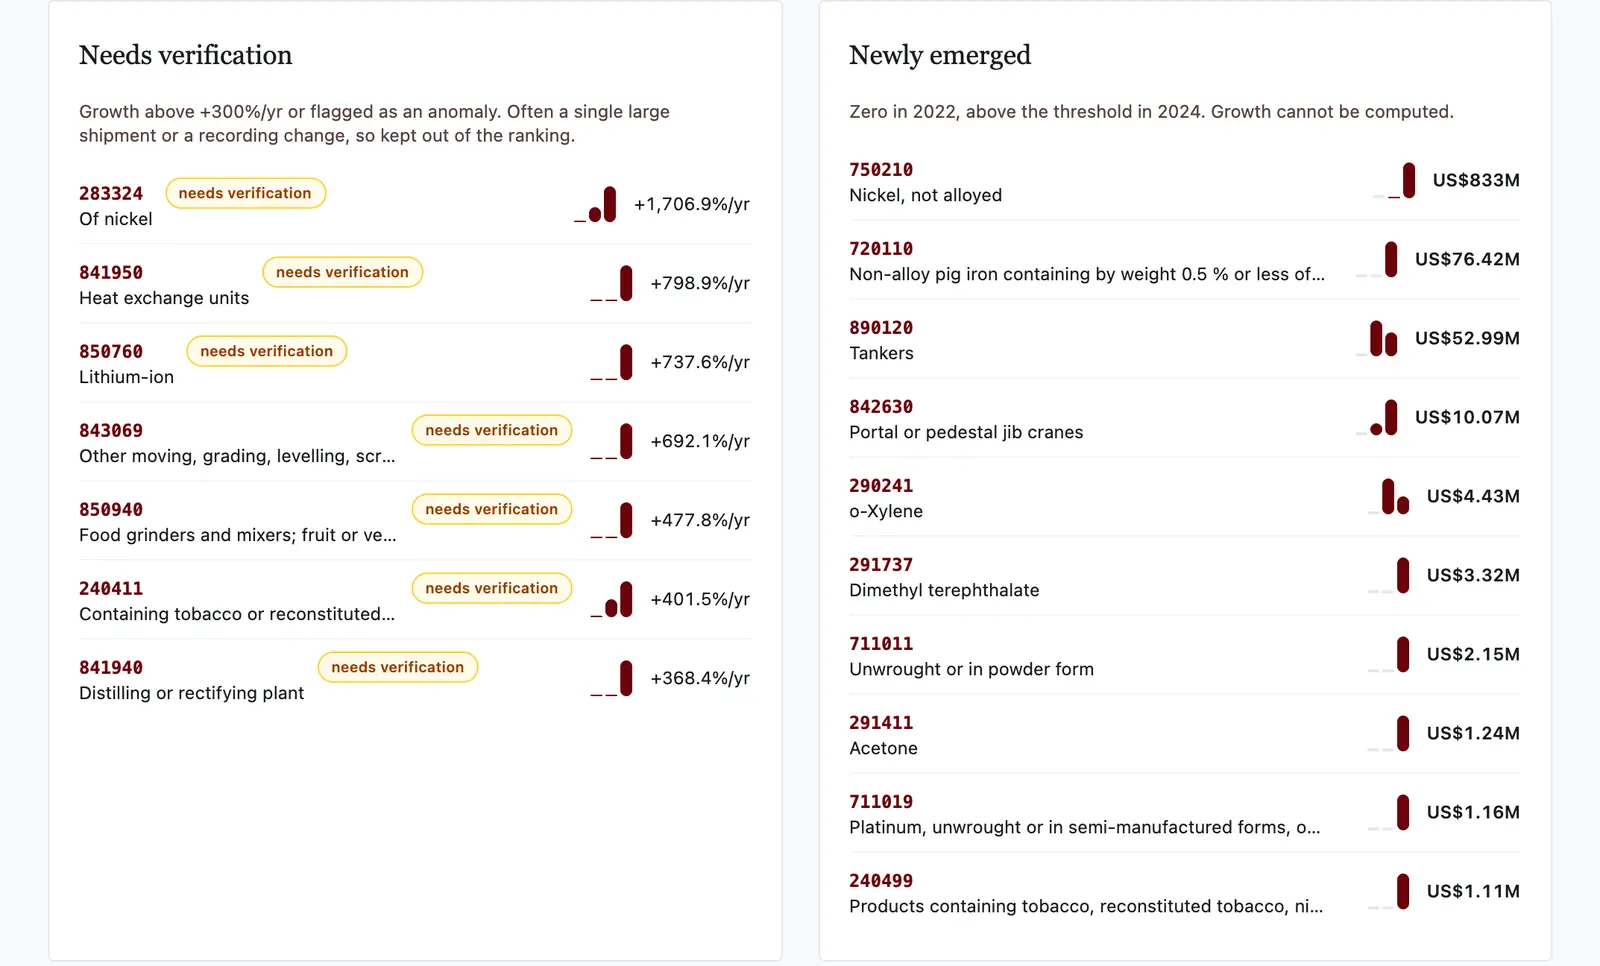
Needs verification
Growth above +300% a year or data flagged as anomalous is kept out of the ranking, as it often comes from one large shipment or a recording change.
What this release shows
Among products with at least US$1 million of Indonesian exports in 2022, 822 grew through 2024. Coke (HS 270400) rose 275.6% a year to US$1.43 billion. Among large markets, Indonesia's exports to Qatar grew 51.7% a year, from US$283 million to US$651 million.
Data release 2026-09-hs6-2022-2024 · period 2022–2024 · updated September 28, 2026
Frequently asked questions
How is growth calculated?
Growth is the 2022–2024 CAGR, only when the 2022 value is above zero. Products absent in 2022 appear as "newly emerged".
Why is there a "needs verification" list?
Growth above +300% a year is often caused by a single large shipment or a code change, so it is kept out of the main ranking.
What is the world demand view for?
To find products with rising world demand, including products Indonesia does not export much yet.
Related features
All Market Data featuresMarket Data is indicative market research, not legal, customs, or investment advice. Data release 2026-09-hs6-2022-2024 · period 2022–2024 · updated September 28, 2026