Skip to content
GetRegNex
GetRegNex Market DataBeta · Free

Know where to export, before you start the paperwork

GetRegNex Market Data shows which countries buy your product, how much of each market Indonesia has not yet captured, who the competitors are, and how ready you are to enter it in terms of tariffs, regulations, and risk.

All 10 Market Data features are included in the Free plan during beta.

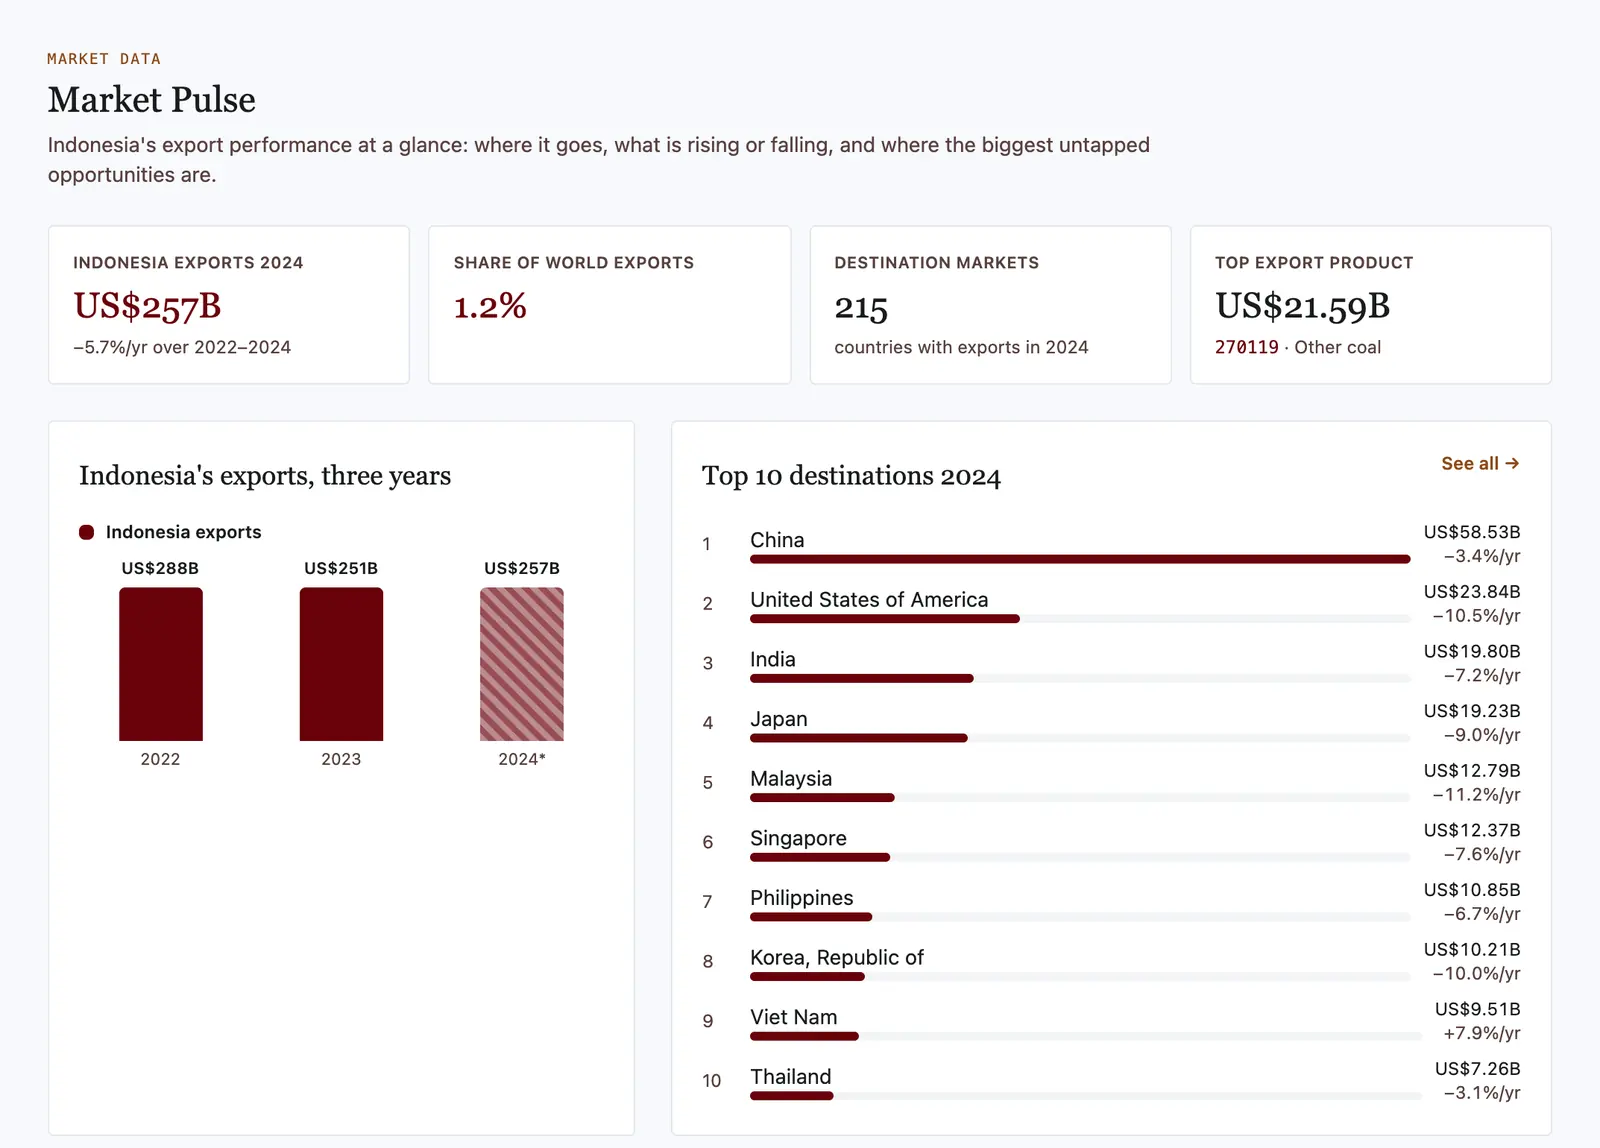
GetRegNex Market Pulse dashboard: Indonesia's 2024 exports of US$257B, 1.2% of world exports, 215 destination countries, and the top 10 export destinations
importing countries & blocs
229 + EU27
HS 6-digit products
5,610
three years of trade data
2022–2024
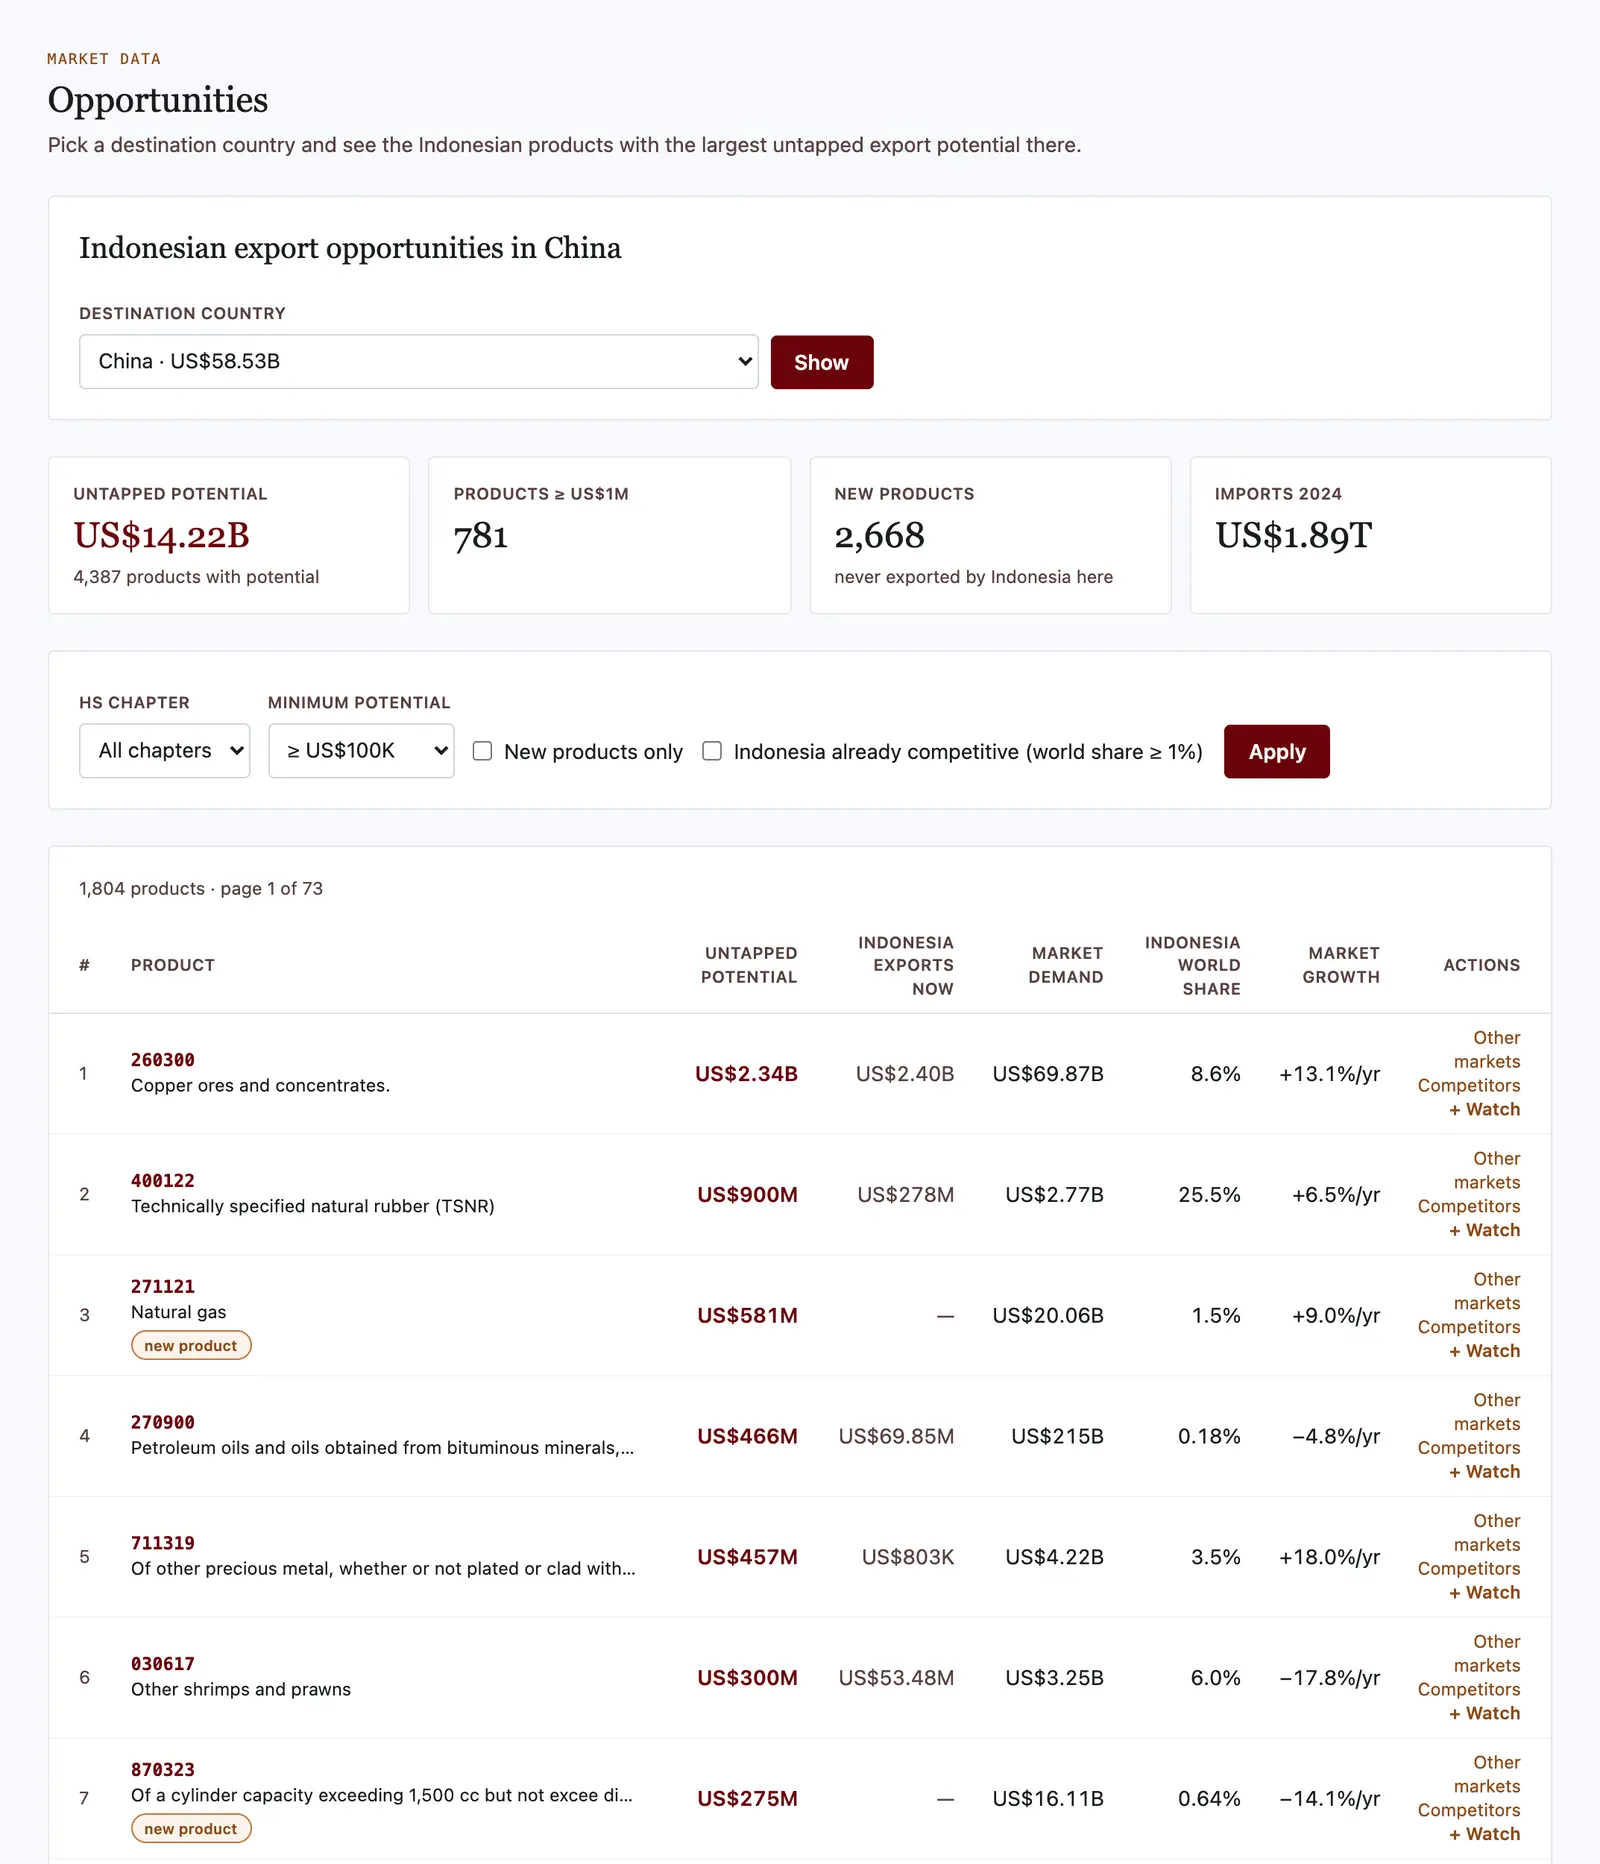
export-potential estimates per product × country
~800K

GetRegNex Market Data covers imports of 229 countries and the EU27 for 5,610 HS 6-digit products, using bilateral trade data for 2022–2024.

Data release 2026-09-hs6-2022-2024 · period 2022–2024 · updated September 28, 2026

Questions Market Data answers

Ten features, grouped the way exporters research a market: see the big picture, study products and countries, find markets, analyse competitors, then track and report.

Overview

How are Indonesia's exports performing?

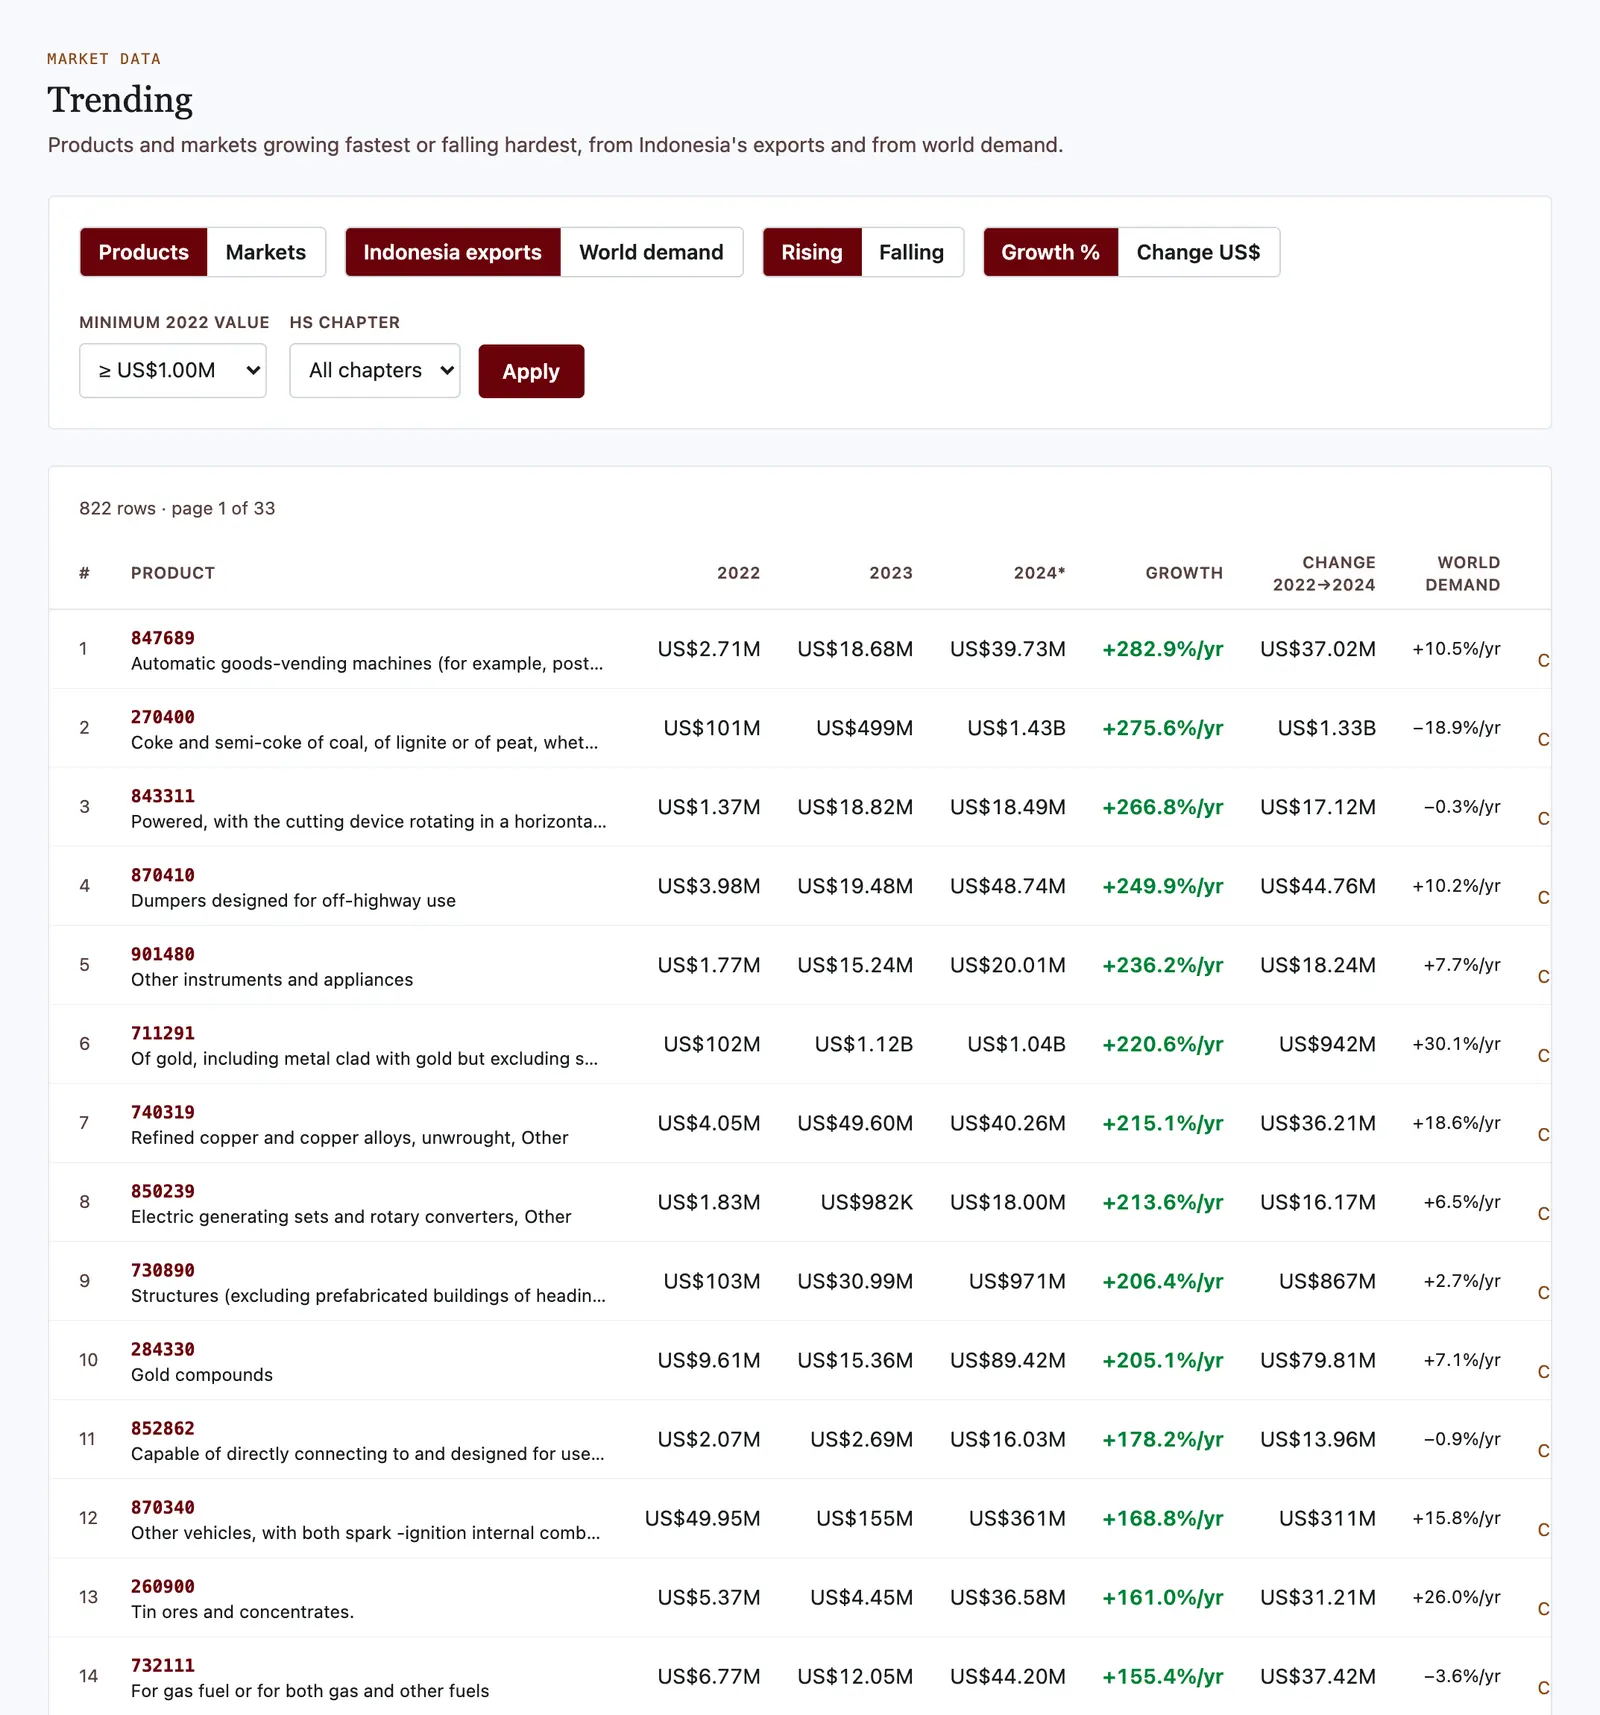
Market Pulse summarises Indonesia's exports on one screen: value and world share, the 10 largest destinations, the fastest rising and falling products, and the largest untapped opportunities.

Market Research

Who buys my product, and what does a target country buy?

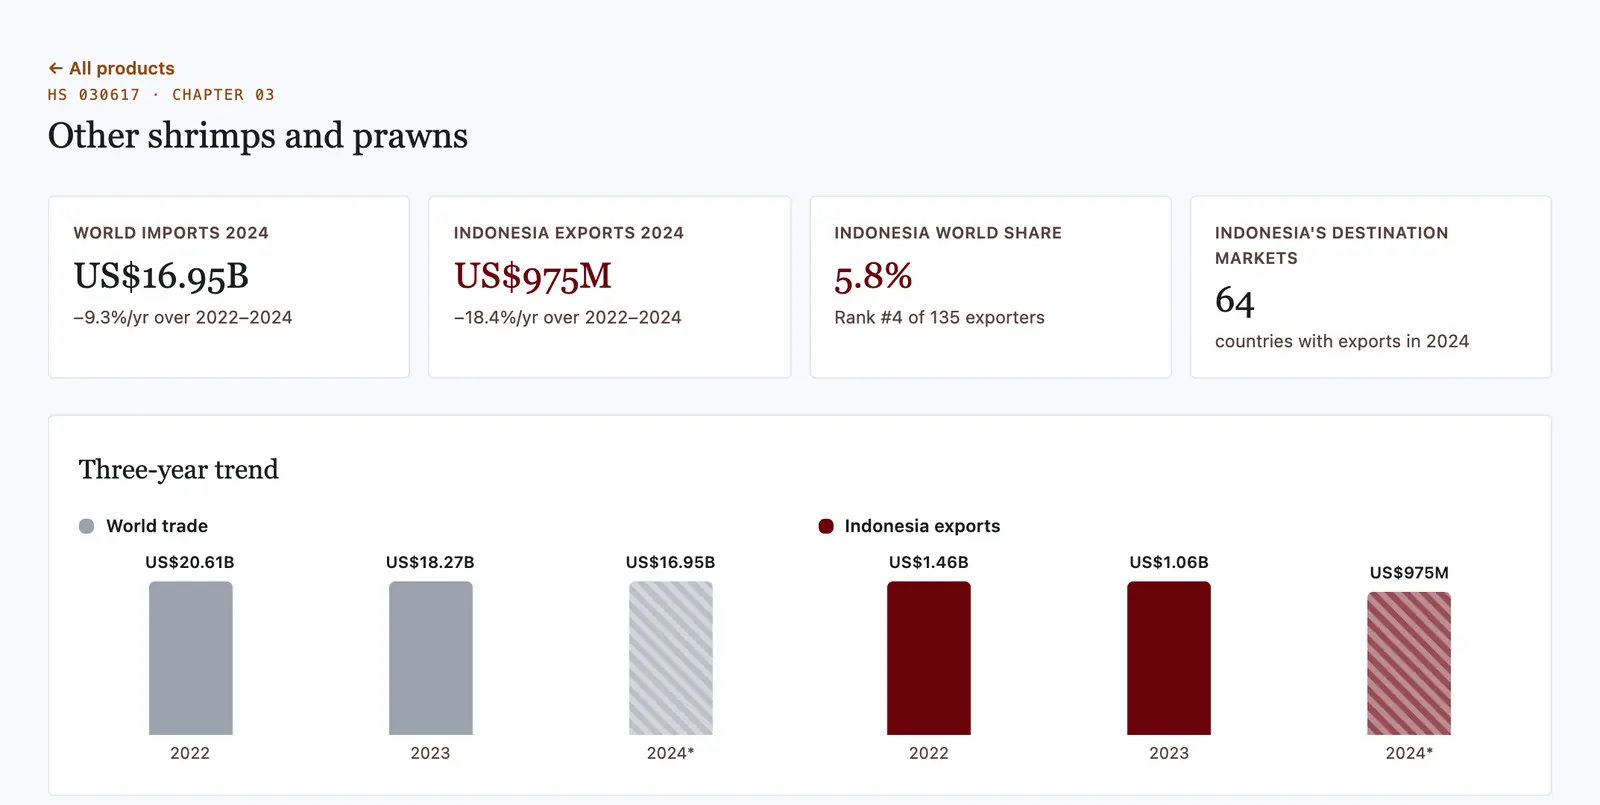
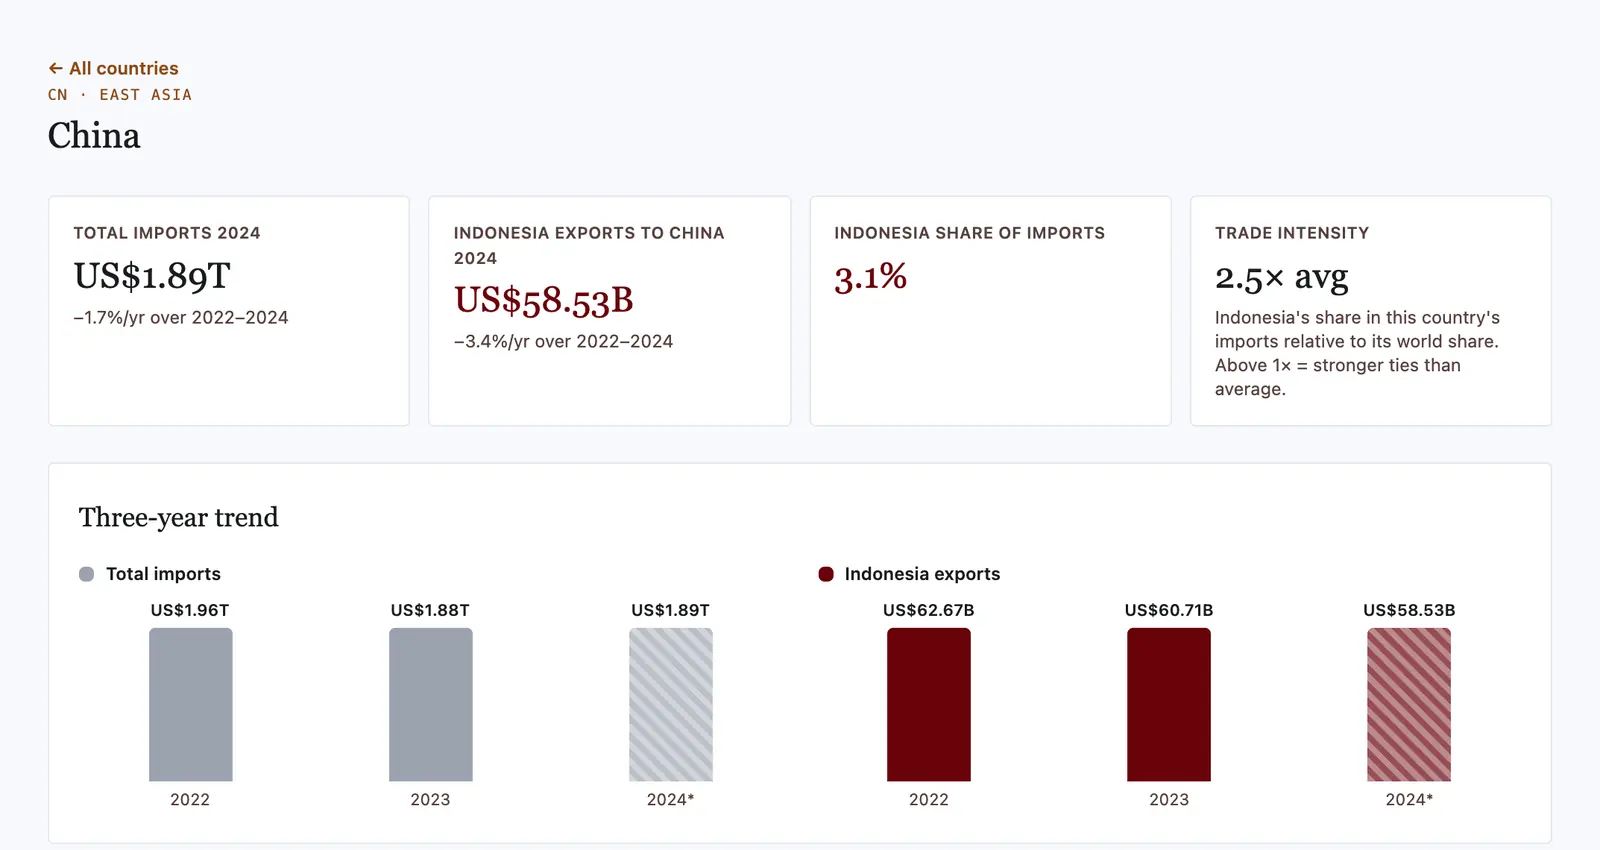
Product profiles list the largest importing countries for one HS code with Indonesia's position; Country profiles show what a country imports and from whom.

  • Products · World market per HS6 code
  • Countries · Import profiles of 229 countries + EU27
Find Markets

Which country is most ready for my product?

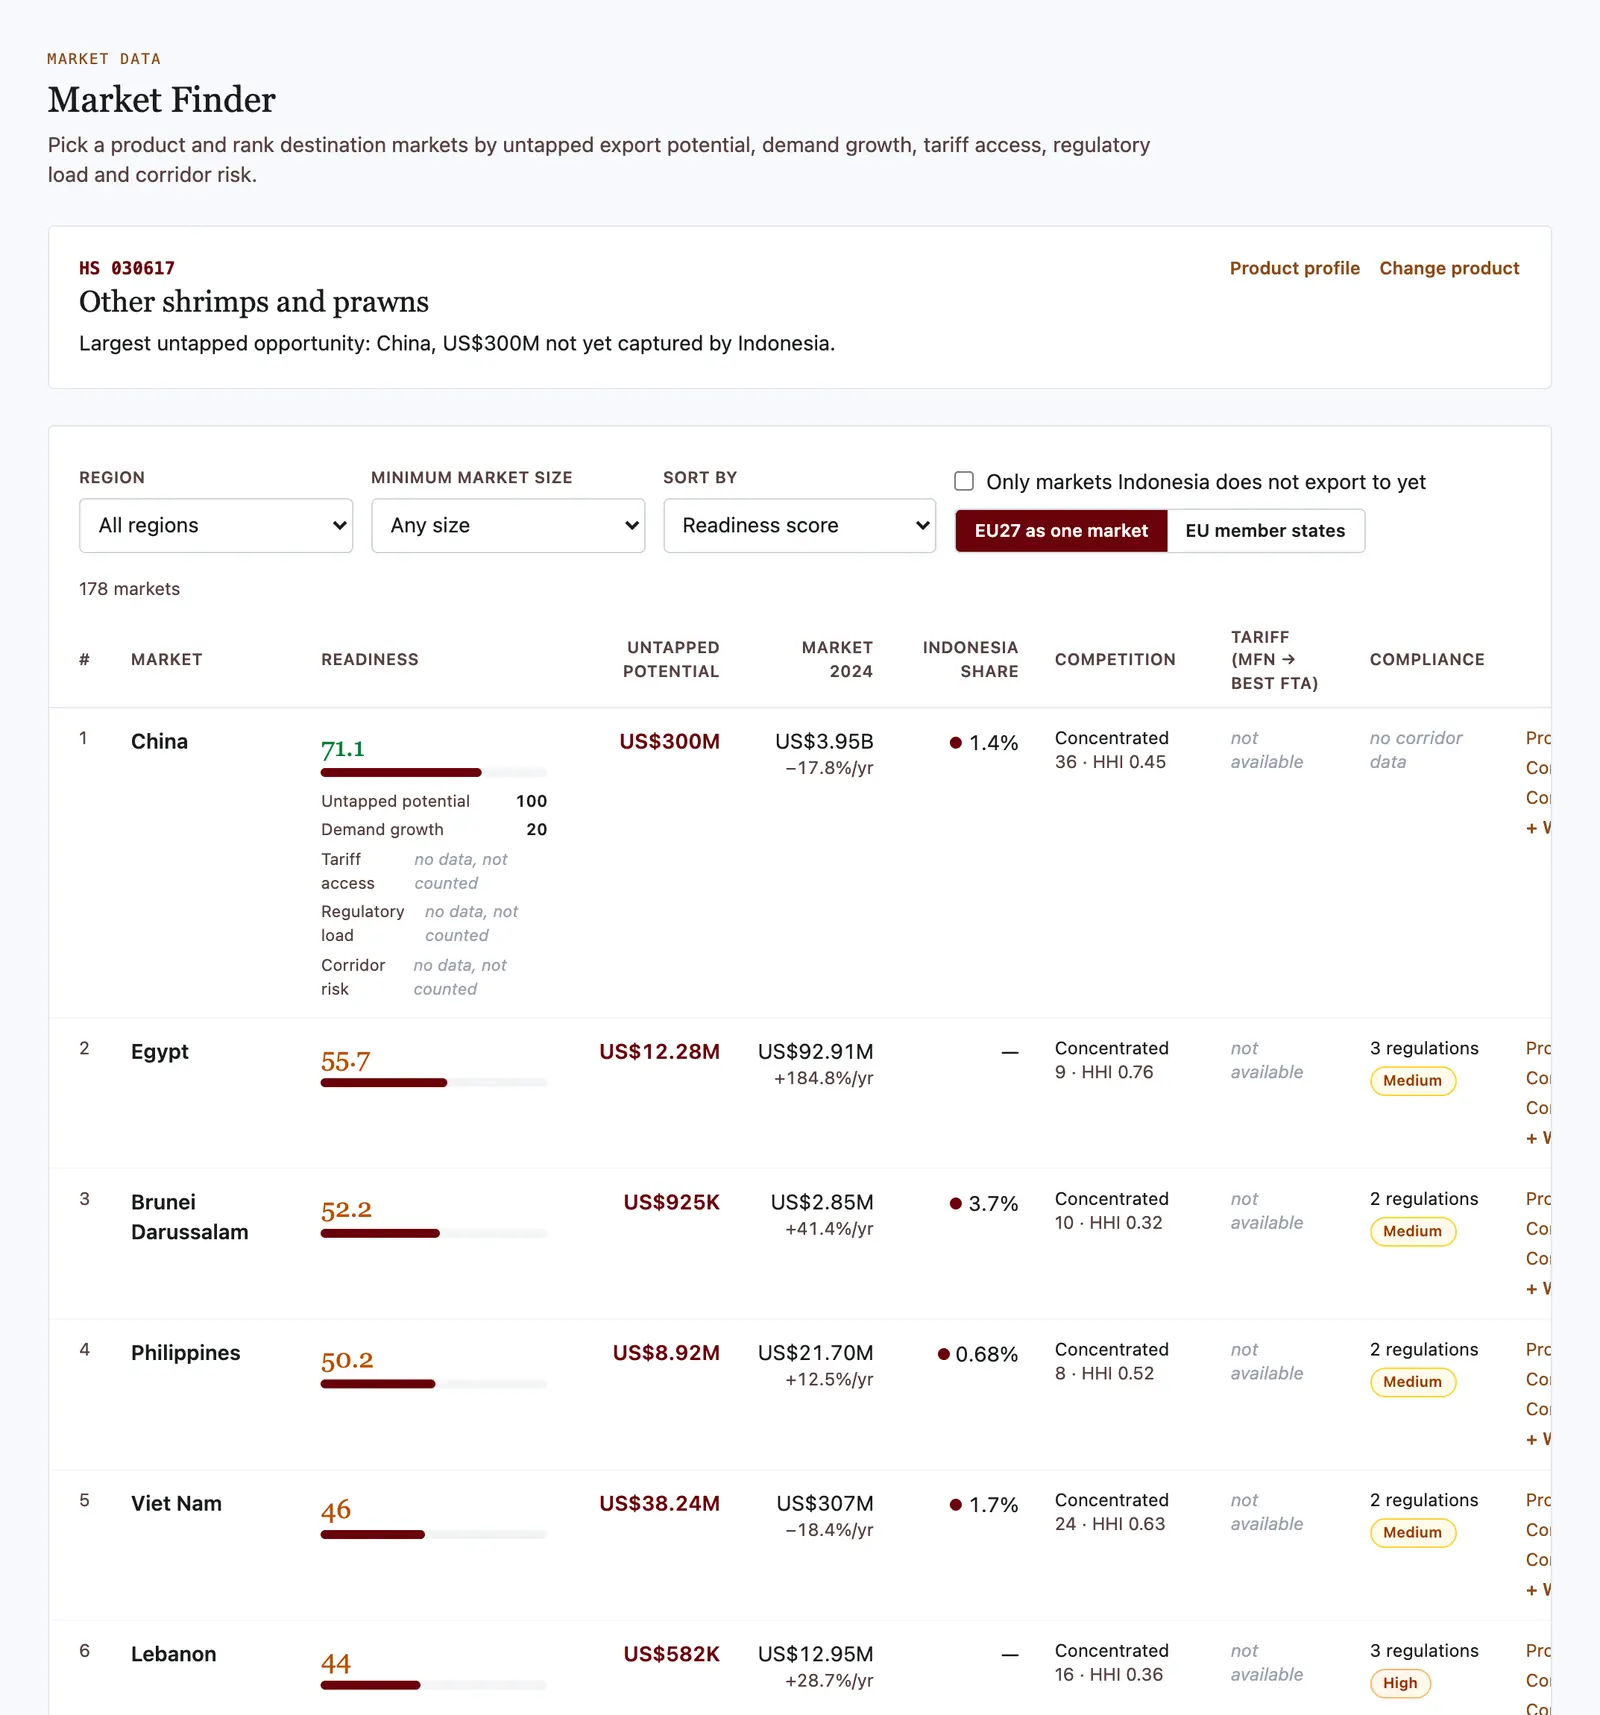
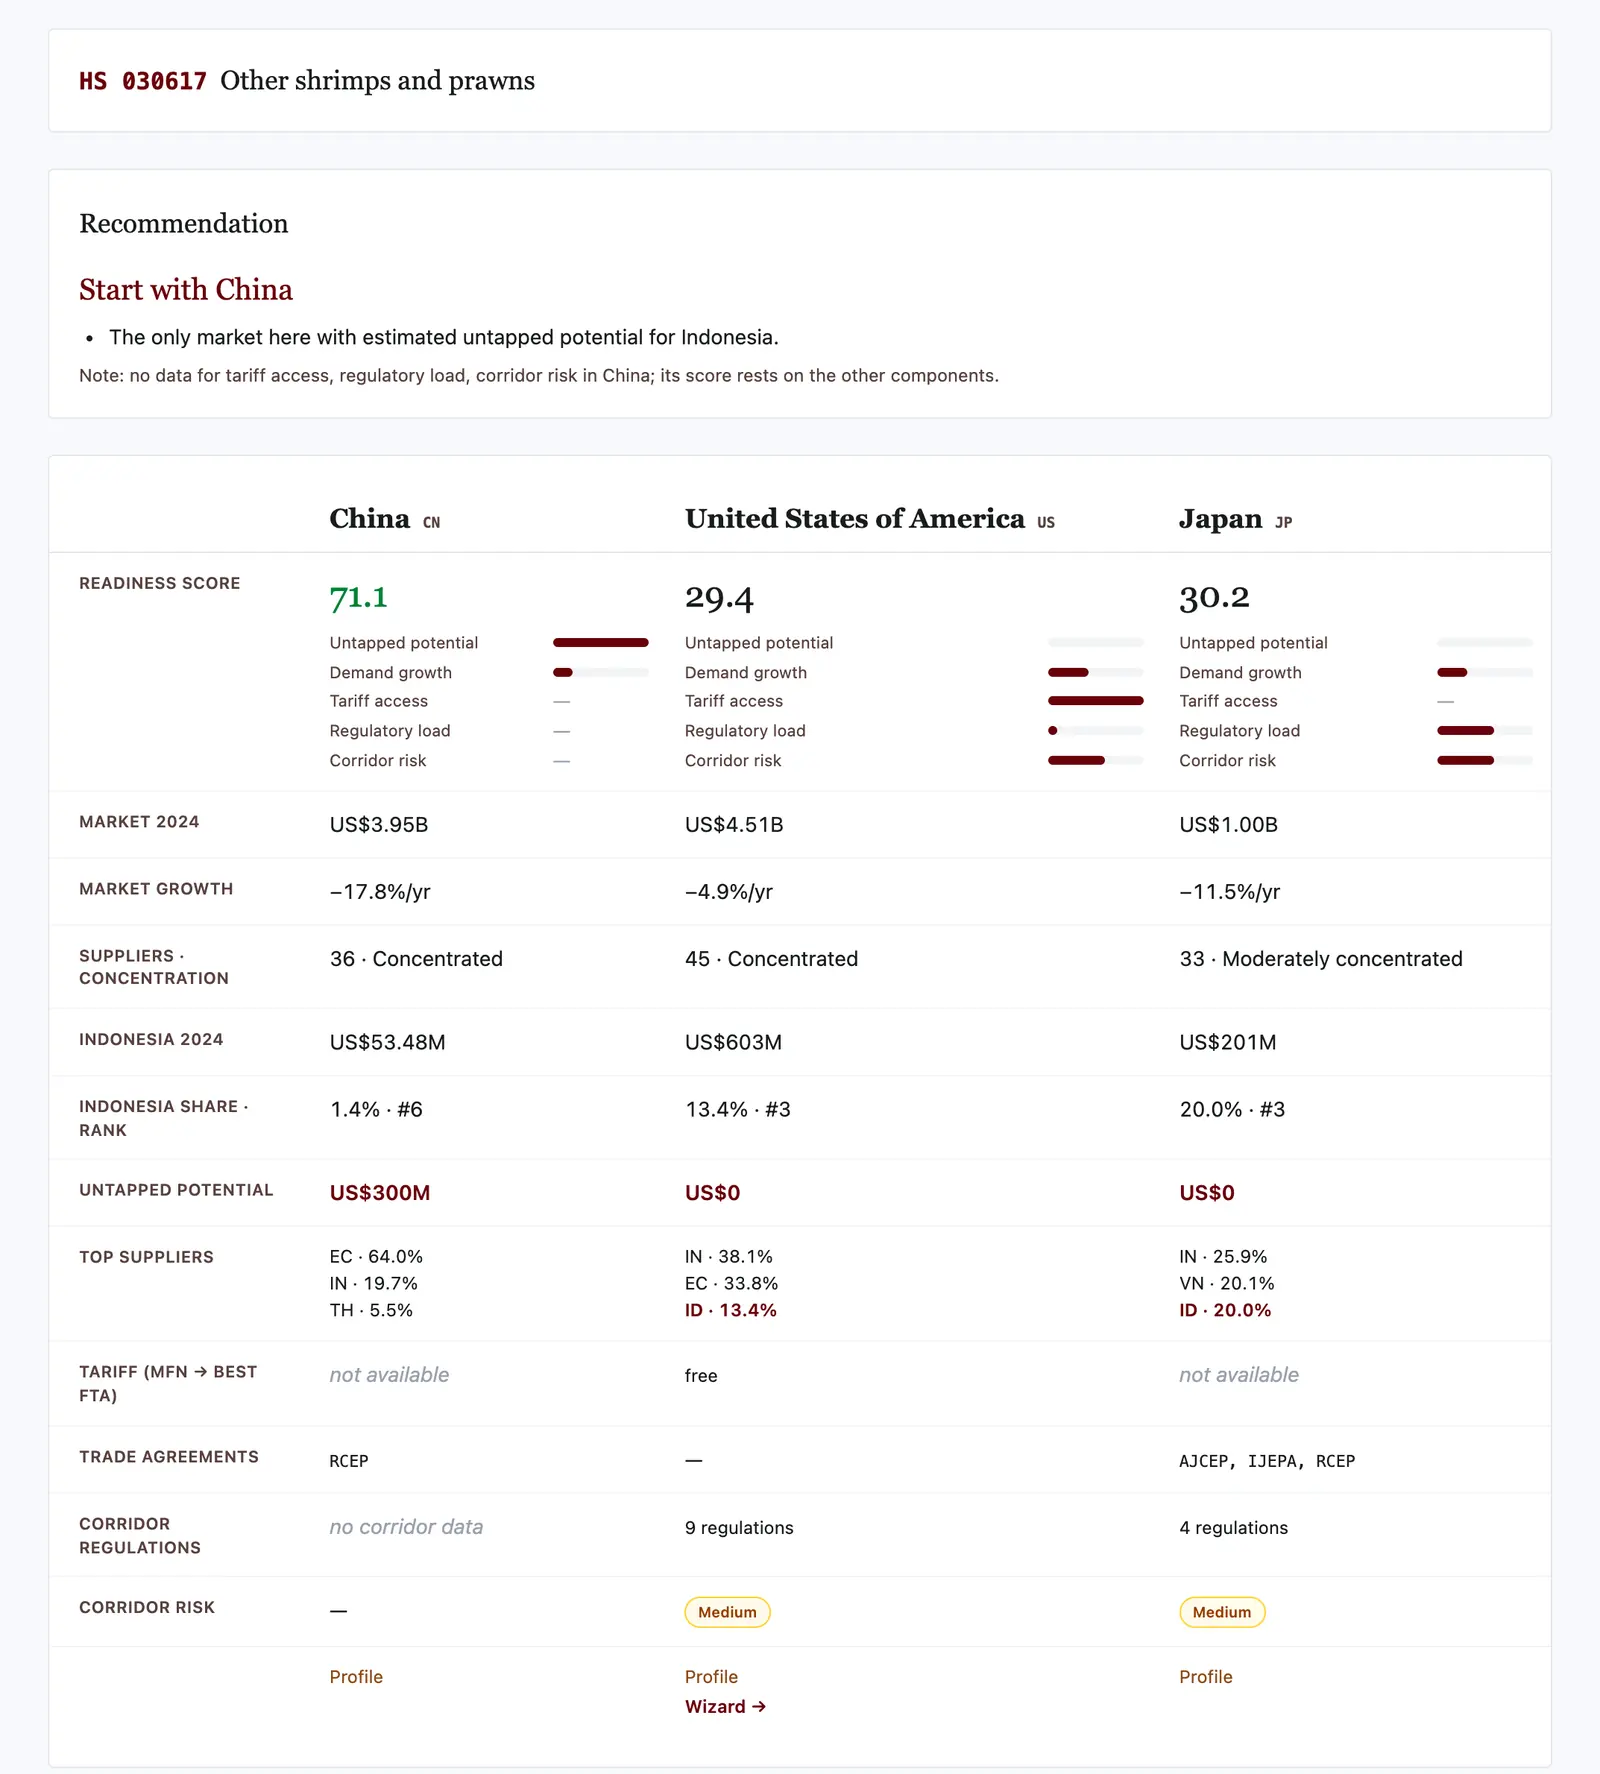
Market Finder ranks every destination with a 0–100 Readiness Score that combines untapped potential, demand growth, tariff access, regulatory load, and corridor risk.

Analysis

Who are my competitors, and how far behind is Indonesia?

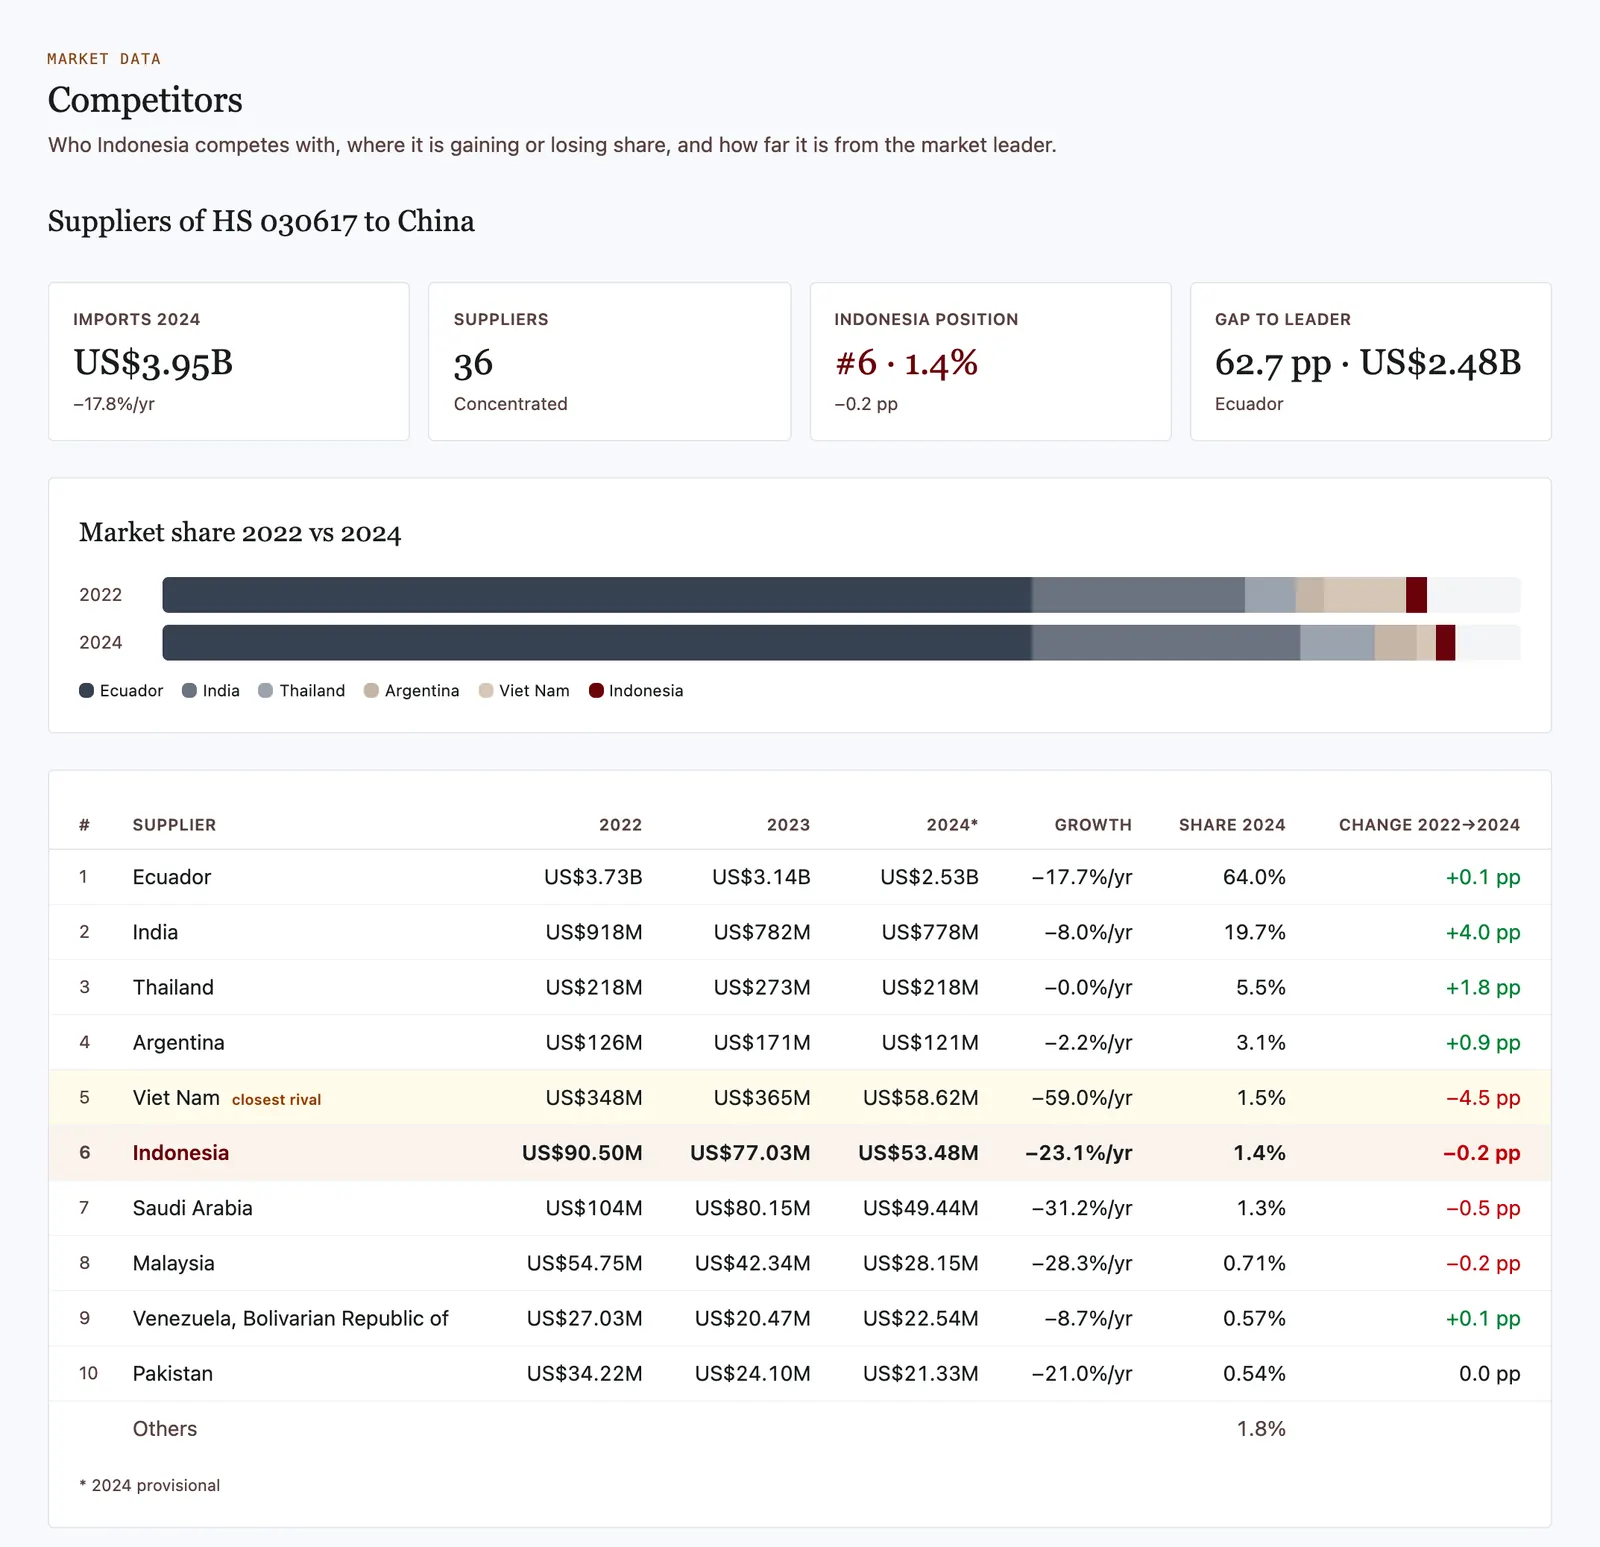
Competitors lists the top 10 suppliers in one market with three years of values, shares, and share changes, then flags the closest rival and Indonesia's gap to the market leader.

  • Compare · Compare 2–3 markets side by side
  • Competitors · Suppliers, shares, and closest rival
Track & Report

How do I know when a market I target changes?

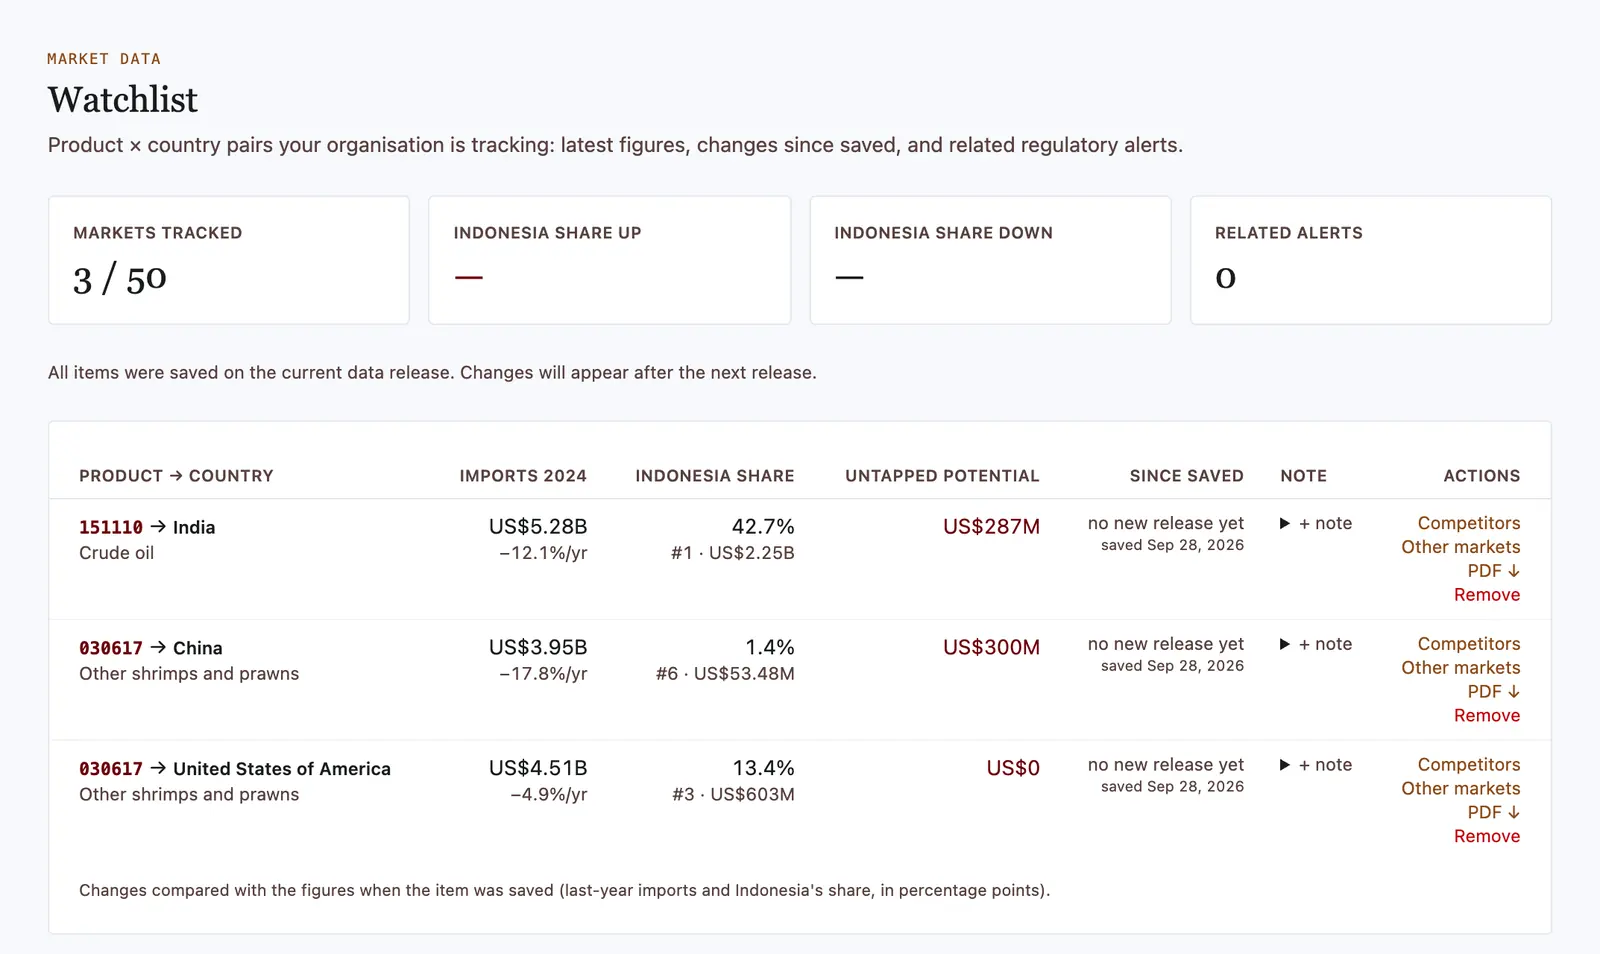
Watchlist saves product × country pairs for your organisation, shows what changed since you saved them, and emails you when new data is released; Reports creates a shareable Market Brief PDF.

  • Watchlist · Track markets + email on new data
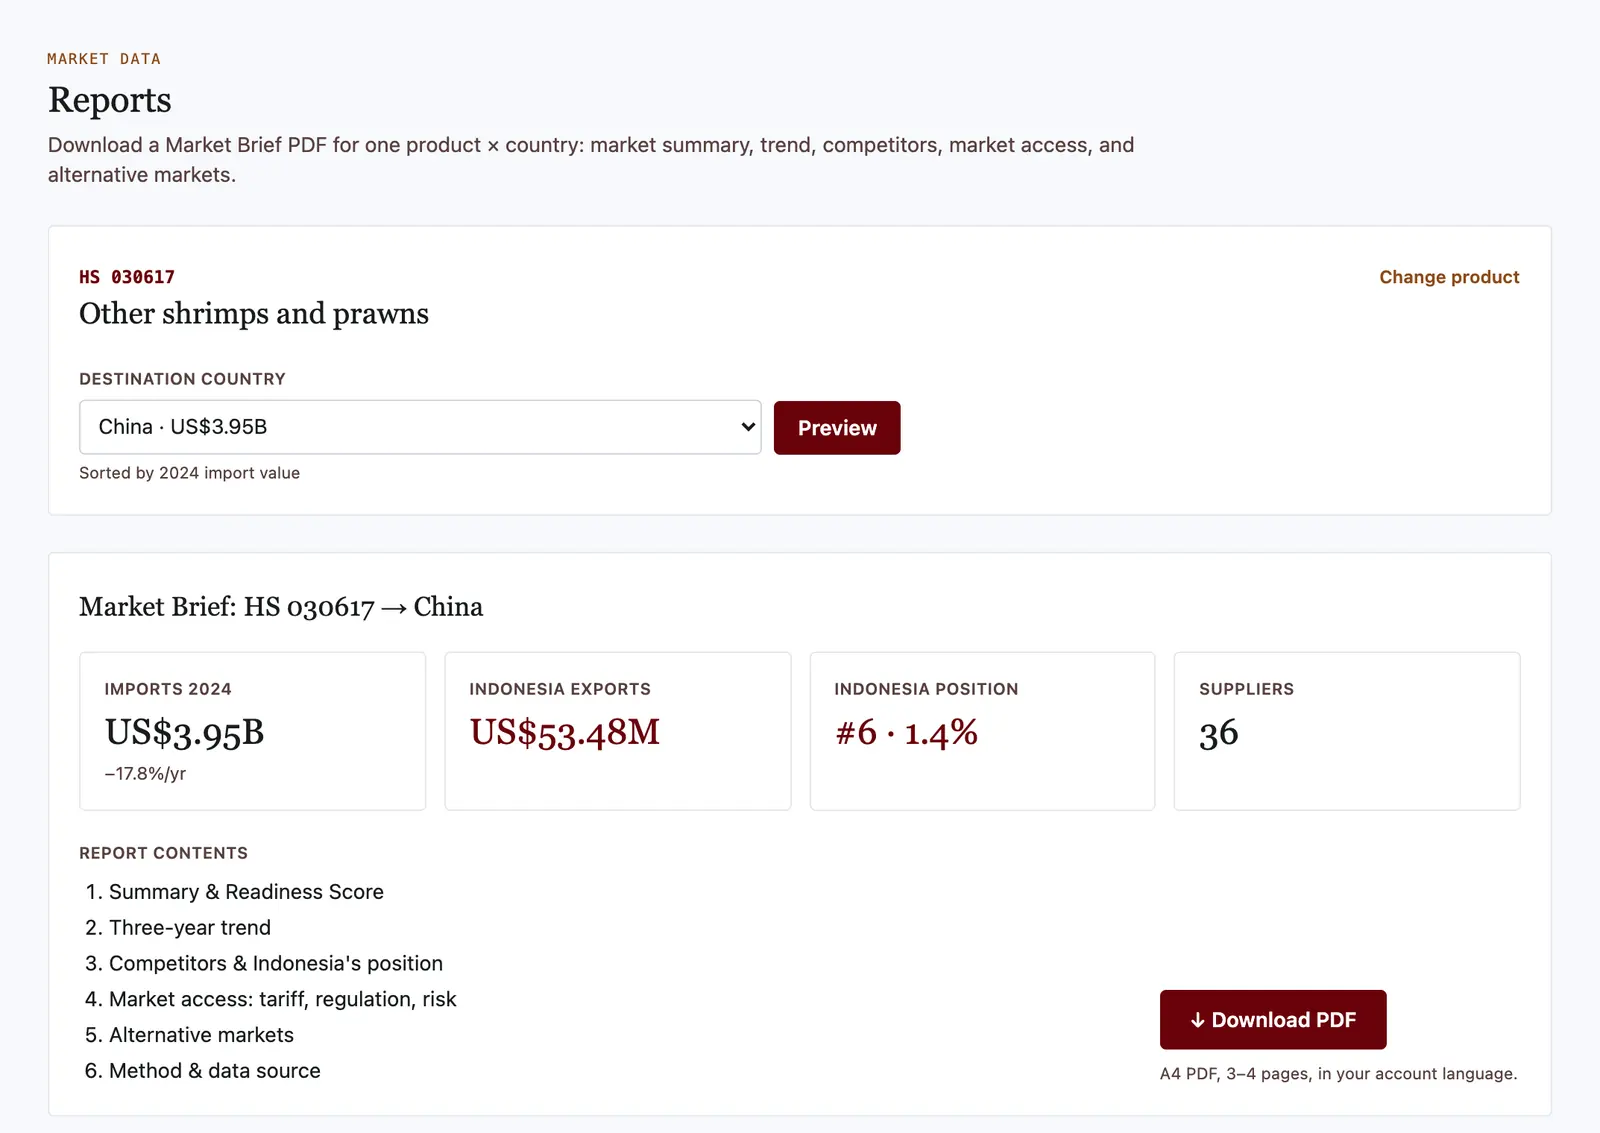
  • Reports · Market Brief PDF per product × country

Real example: frozen shrimp to China

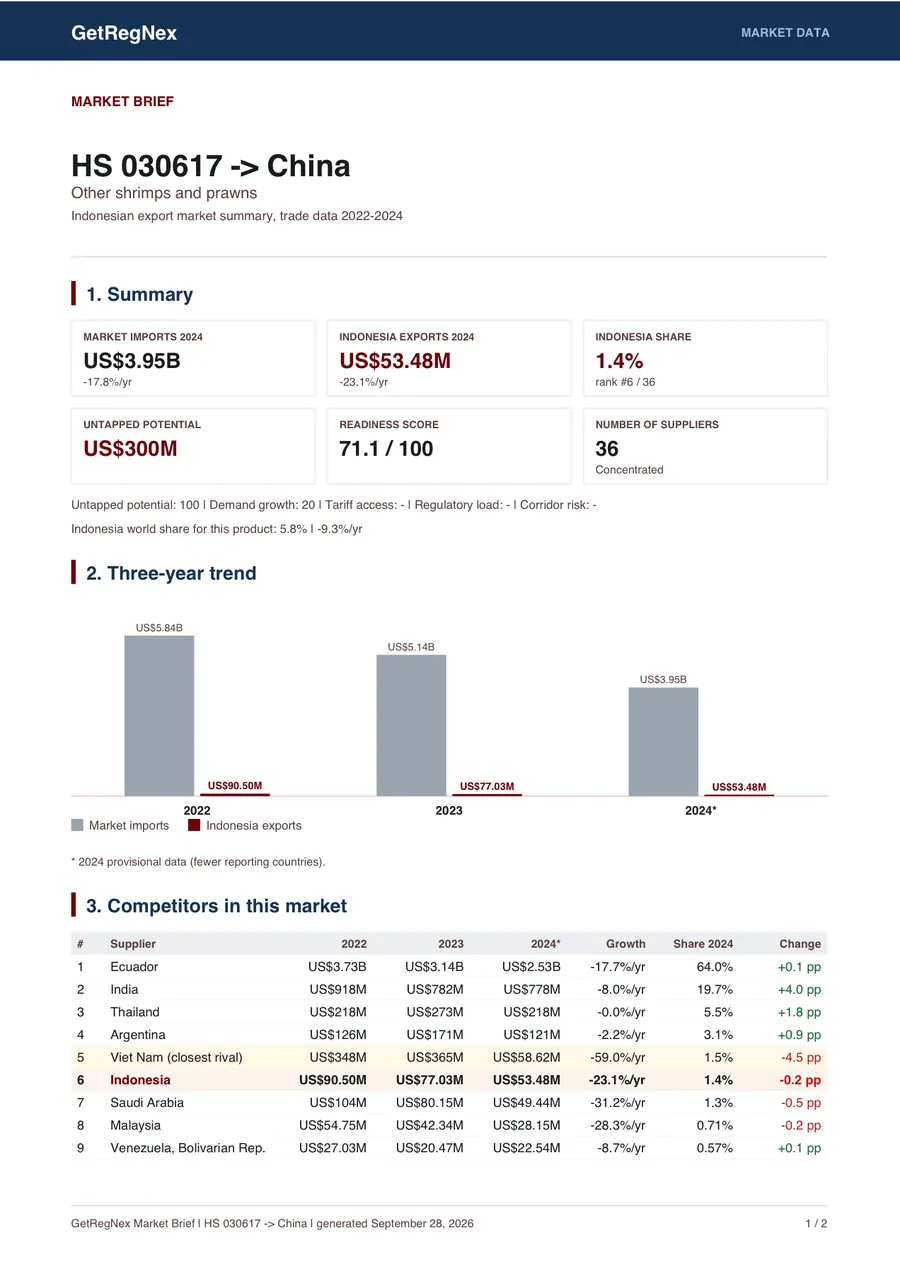
For frozen shrimp (HS 030617), China imported US$3.95 billion in 2024 from 36 suppliers. Indonesia ranks #6 with a 1.4% share, while Ecuador leads with 64%. Indonesia's untapped export potential in China is estimated at about US$300 million, and China ranks first in Market Finder for this product with a Readiness Score of 71.1.

US$3.95B

China imports 2024

#6 · 1.4%

Indonesia rank & share

~US$300M

untapped potential

Data release 2026-09-hs6-2022-2024 · period 2022–2024 · updated September 28, 2026

GetRegNex Competitors page for frozen shrimp HS 030617 to China: top 10 suppliers, Indonesia ranked 6th with a 1.4% share, Ecuador leading with 64%
GetRegNex Market Finder for frozen shrimp: 178 markets ranked by Readiness Score, China first with 71.1

Key terms

Untapped export potential
Untapped export potential is the estimated additional export value Indonesia could reach in a country if its share there matched its world market share, adjusted for ease of trade, minus current exports.
Readiness Score
The Readiness Score is a 0–100 value that combines untapped potential, demand growth, tariff access, regulatory load, and corridor risk to rate how ready a market is to enter.
HS6
HS6 is the 6-digit Harmonized System code that every country uses to classify traded goods; Market Data works at this level so data can be compared across countries.

How to use it

  1. 1

    Enter your product

    Search your HS code or product name.

  2. 2

    Compare markets

    Review the Market Finder ranking, competitors, and trends.

  3. 3

    Track & share

    Save to Watchlist or download a Market Brief PDF.

Connected to compliance

The Readiness Score uses the same tariff, regulation, and corridor-risk data as GetRegNex's compliance modules. For active export corridors (European Union, United States, Australia), one click takes you to the Compliance Wizard to check documents and shipment requirements.

Sample GetRegNex Market Brief PDF: market summary, Readiness Score, three-year trend, and competitor table

Data & method

  • Source: bilateral HS6 trade dataset 2022–2024 in nominal USD, reconciled values (the export side is used for every country).
  • 2024 figures are provisional because fewer countries have reported.
  • The EU27 is counted as imports from outside the European Union (extra-EU), not the sum of member-state imports.
  • Export potential uses a simplified version of the International Trade Centre (ITC) Export Potential method.
  • Growth above +300% a year or a base value under US$100K is flagged “needs verification” and kept out of rankings.

Data release 2026-09-hs6-2022-2024 · period 2022–2024 · updated September 28, 2026

Market Data is indicative market research, not legal, customs, or investment advice.

Frequently asked questions

Is GetRegNex Market Data free?

Yes. During beta, all 10 Market Data features, including Watchlist and the Market Brief PDF, are included in every GetRegNex plan, including the Free plan. You only need an account.

Where does the data come from and how recent is it?

Market Data uses a bilateral HS6 trade dataset for 2022–2024 in USD with reconciled values. 2024 figures are provisional. Every new release is reviewed by the GetRegNex team before it goes live, and Watchlist users get an email when it does.

Which countries and products are covered?

Market Data covers imports of 229 countries plus the EU27 as one market, for 5,610 products at the HS 6-digit level.

How is export potential calculated?

Potential uses a simplified version of the ITC Export Potential method: Indonesia's world market share multiplied by the destination's demand, adjusted for ease of trade. Untapped potential is the gap between that potential and Indonesia's current exports. The figure is indicative, not a sales forecast.

Can I download a report?

Yes. Reports creates a Market Brief PDF for one product and one country, with a market summary, Readiness Score, three-year trend, competitors, market access, alternative markets, and the method and data source.

How is Market Data different from the Compliance Wizard?

Market Data helps you choose a market: which country offers your product the best opportunity. The Compliance Wizard helps you enter it: tariffs, documents, and regulatory requirements for one shipment. Both are connected through the same export corridors.

Start with a product you already export

Enter one HS code and see which countries offer the best opportunity, in under a minute.

Try it free

Start Your GetRegNex Free

Run the Compliance Wizard for your top trade products and help shape the platform. Free users receive full Pro access and early pricing.